Correlation vs. Causation: Avoiding Misleading Insights in Data Analysis
One of the most common traps in data analysis is confusing correlation with causation.
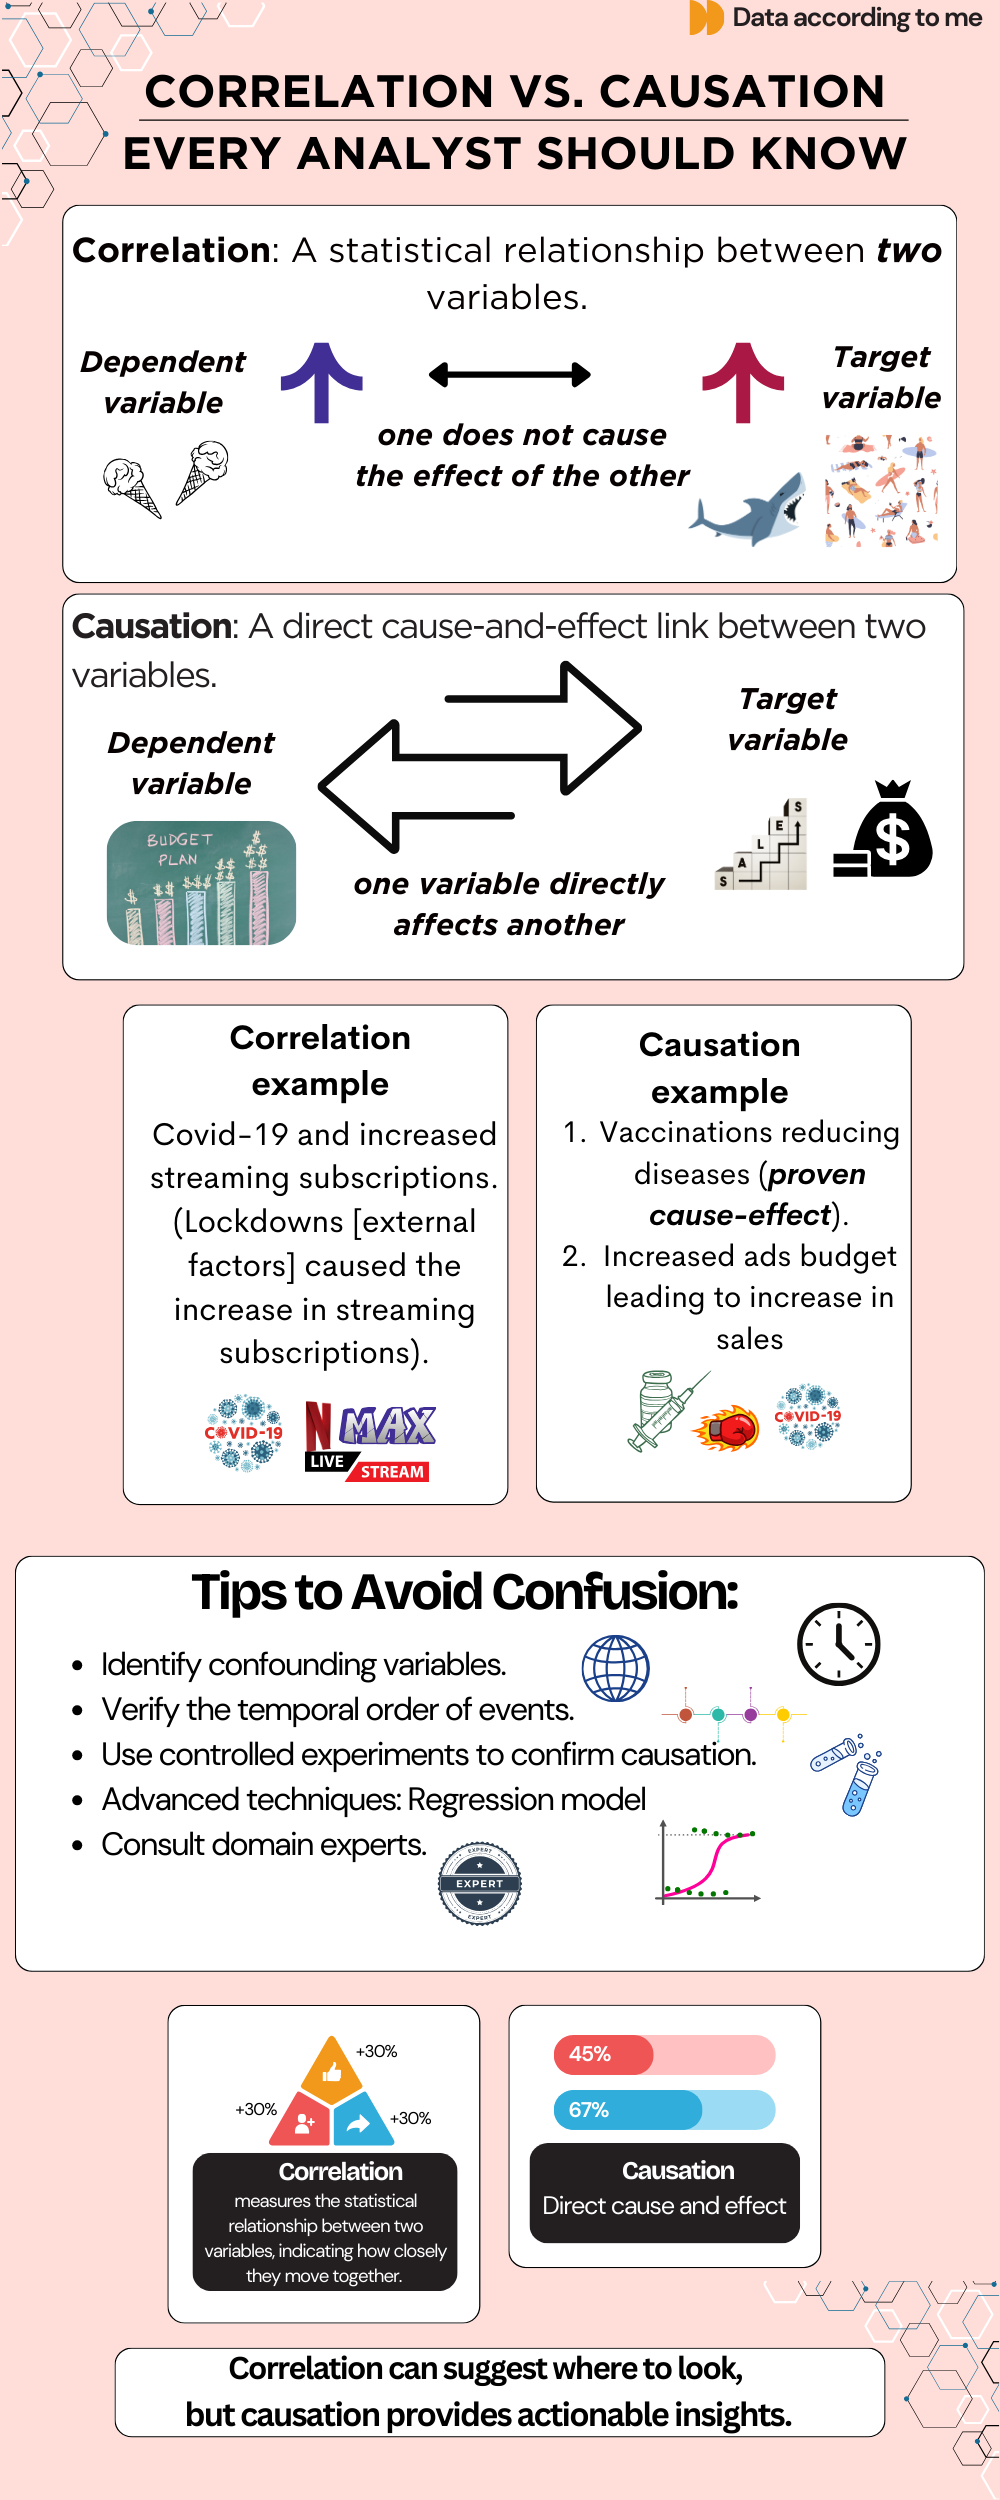
One of the most common traps in data analysis is confusing correlation (a statistical association between variables) with causation (a relationship where one variable directly influences another).
Every data analyst knows that data has many relationships, but not all relationships relate.
With correlation and causation, it gets tricky because misinterpreting them can lead to incorrect conclusions and costly decisions.
I’ll clarify the difference, share real-world examples, and outline simple techniques for avoiding this trap.
This infographic can be useful to help you quickly understand the difference.
What is Correlation?
Correlation measures the statistical relationship between two variables, indicating how closely they move together. It’s usually quantified by the correlation coefficient (r):
r = 1: Perfect positive correlation (as one variable increases, the other increases).
r = -1: Perfect negative correlation (as one variable increases, the other decreases).
r = 0: No correlation.
However, correlation doesn’t mean one variable causes the other to change — it merely highlights an association.
What is Causation?
Causation indicates a cause-and-effect relationship where changes in one variable directly lead to changes in another. Proving causation requires more in-depth analysis, like:
Controlled experiments.
Temporal sequencing (does one event always precede the other?)
Eliminating confounding factors
Differences between the two
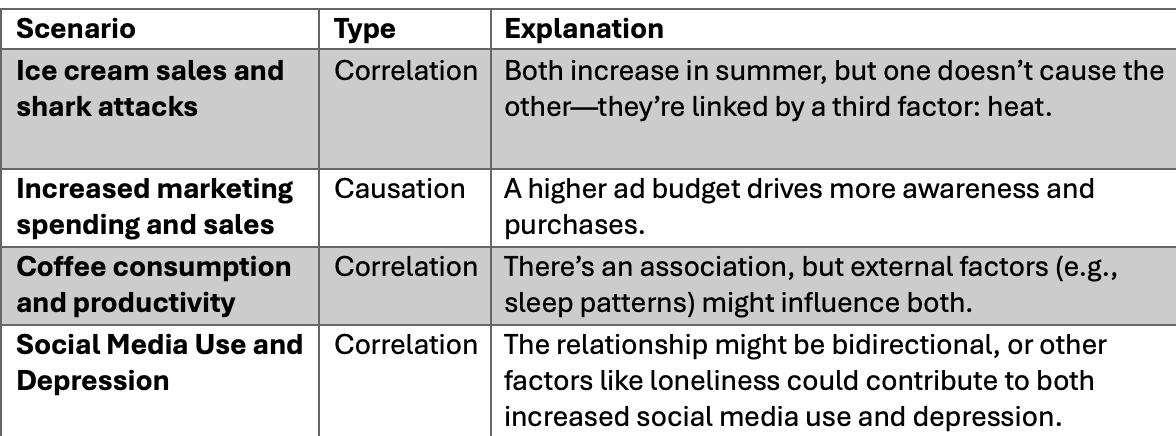
Real-life scenarios to show correlation vs causation:
Correlation is not causation?
Confounding variables: When you have a confounding variable(s), that means there are external variables that influence both variables, which should be under consideration, potentially causing a false association.
Reverse causality: The possibility that the supposed effect is actually the cause. So, it’s not correlation, but the effect is the causal agent.
Coincidence: The association between two variables may be due purely to chance, especially in large datasets.
Example of confounding variables:
Third Variable Problem: In the ice cream and shark attacks example, temperature is the confounding variable affecting both.
How to test causation:
1. Run controlled experiments: Randomized controlled trials (RCTs) are the gold standard for proving causation. Participants are randomly assigned to a treatment or control group to isolate the effect of the independent variable.
For example, A/B testing measures whether a specific campaign boosts conversions or tests a new medication by comparing outcomes between a group that receives the drug and a group that receives a placebo.
Check temporal order/precedence:
Does one variable consistently precede the other? This helps establish causation, i.e., the cause happens before the effect.
For example, increasing ad spending before a rise in sales supports causation.
3. Look for and eliminate confounding variables: Always question whether an external factor drives the relationship. This can help eliminate alternative explanations. For example, variables like age, income, or education should be included in regression models to isolate the effect of the primary independent variable.
Use Advanced (statistical) techniques:
Regression Models: Include control variables to isolate the effect of interest.
Granger Causality Tests: For time-series data, test whether one variable predicts another over time.
Tips to avoid misinterpreting correlation as causation
Question the relationship: Always ask whether a logical cause-and-effect relationship exists between the variables.
2. Identify potential confounders: Knowing what confounders are, always consider other variables that might be influencing both variables under study.
3. Look for consistency across your studies: Causation is more plausible when multiple studies yield similar results under different conditions.
4. Consult domain experts:
Consulting experts is a faster way for a new data analyst or data scientist to learn these differences. Experts can provide insights into plausible mechanisms linking the variables.
5. Use appropriate statistical methods: Employ statistical techniques designed to infer causality carefully.
Distinguishing between correlation and causation is vital for accurate data analysis. By being cautious and applying rigorous methods to test for causation, you can avoid common pitfalls and make more informed decisions based on your data insights.
“Correlation can suggest where to look, but causation provides actionable insights.”
Be data-informed, data-driven, but not data-obsessed — Amy
Biz and whimsy: https://linktr.ee/ameusifoh
🔗 Connect with me on LinkedIn and GitHub for more data analytics insights.
#Dataanalysis #DataScience #Python #Tableau #PowerBI #Looker #Excel
Data Enthusiast | Spreadsheet Advocate | turning data into useful insights


Thank you for the detailed breakdown of correlation vs. causation. It is astonishing how easily we can conflate the two. I have been guilty of it!
What do you have your degree in? Let me know if you want to partner up on a study for publish in a journal.