The Bookstore That Outsmarted Big Data: How Small Data Uncovered Insights AI Couldn’t
Turning Laura's data to dollars
Big tech companies are using big data and machine learning for some of the most incredible things you can think of, and rightly so. And, it’s easy to forget the value of small data.
The buzzwords are everywhere:
“AI-powered analytics,” “real-time data streams,” and “data lakes”
But what if you’re a small business owner with no budget for AI and no need for millions of rows of data? Can you still unlock game-changing insights?
This is the story of Laura, a bookstore owner who transformed her business — not with big data, but with small, focused datasets. No algorithms, no data warehouses — just critical thinking, a spreadsheet, and 16 hours of analysis. And the results? Impactful results and proof that sometimes the most powerful insights come from the smallest datasets.
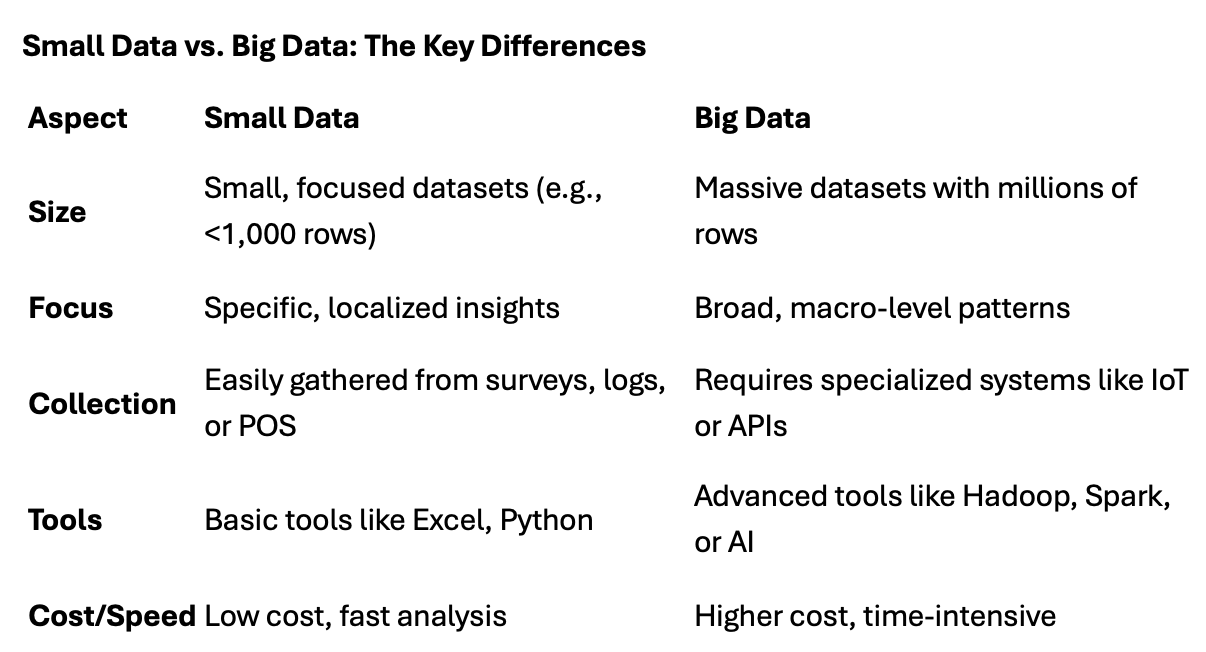
Big data has transformed how businesses operate, providing large-scale insights and fueling technological advances. However, not all decisions require millions of rows of data or complex models. Sometimes, small data can yield actionable insights with less effort and cost.
While big data often takes the spotlight, sometimes, many organizations overlook a surprising hero: small data.
In this article, I take you through my role of analyzing small data and how it complements big data, using small data in a local bookstore. By the end, you’ll see how small data can be just as impactful, depending on the context.
Big Data vs. Small Data: Why Both Matter
Before getting into Laura’s story, let’s be clear: Big data isn’t the enemy here. It’s a powerhouse for solving large-scale problems, like optimizing global supply chains or predicting consumer trends across millions of users. But sometimes, small, focused data has the answer when it comes to solving specific, localized problems — like why your sales are dipping or how to engage your customers.
Think of big data as a satellite image of a city. It’s great for identifying overall patterns, like traffic congestion. But if you want to find the best parking spot at your favorite coffee shop, do you need a complicated model to tell you this? You just need to know the high traffic hours and availability of spaces.
The Question That Changed Everything
Laura wasn’t new to hard times. Running a bookstore in the digital age wasn’t for the faint of heart. But the pandemic had made things worse. Sales were down, customer foot traffic was unpredictable, and she couldn’t figure out why.
Laura’s bookstore was more than just a shop — it was a community hub. But as foot traffic declined and sales faltered, she faced the harsh reality of mounting costs and dwindling revenue. What was the problem? Was it competition? Changing customer preferences? Operational inefficiencies?
She heard about “big data” transforming businesses — massive datasets used by tech giants. But her bookstore didn’t have millions of customers or access to sophisticated tools. She had spreadsheets: one tracking daily foot traffic, another logging sales by category, and a customer feedback survey with just 100 responses.
She didn’t need “big” data — she needed meaningful data.
Her “aha” moment came over coffee with a data analyst, whose main theme is humanity. She asked her: “Why don’t we start small? Let’s start with what you already have. Track what’s happening daily — who’s coming in, what they’re buying, and what they’re saying about us in a survey. The answers are probably right in front of us.”
That was it. No fancy tools or consulting firms — just a plan to track foot traffic, sales by category, customer satisfaction, and recommendations for 60 days.
I knew what questions I needed answers to:
How does foot traffic correlate with daily sales?
Which book categories drive the most revenue?
What’s the store’s conversion rate (foot traffic to sales)?
What are customers saying about their experience?
How can weekend operations be optimized?
Over 60 days, we gathered:
Foot Traffic: A manual count of daily visitors.
Sales Data: Revenue split by Fiction, Non-Fiction, and Children’s Books.
Customer Feedback: Satisfaction scores (1–10) and likelihood to recommend (Yes/No).
Let the Analysis Begin
The Disconnect Between Foot Traffic and Sales
One of Laura’s biggest assumptions, that more visitors automatically meant more sales was wrong. Plotting foot traffic against daily sales showed that more visitors didn’t always mean more sales.
On busy days, conversion rates dropped to as low as 40%, while on quieter days, they climbed to 70%. Customers were browsing but not buying. This hinted at operational bottlenecks during peak times.
Category-Level Revenue Insights
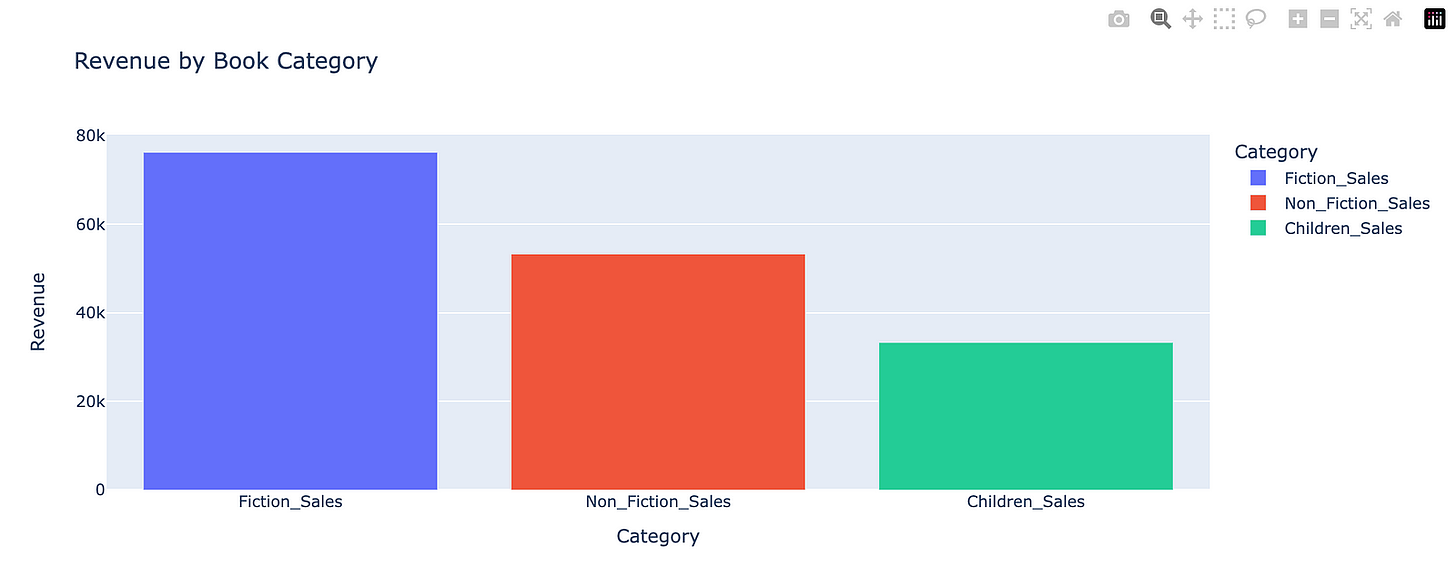
Using a simple pivot table in Excel, I broke down sales by category:
Fiction: 53% of revenue.
Non-Fiction: 29%.
Children’s Books: 18%.
While fiction was the leader, customers commented that the Children’s Books section felt neglected. This was a missed opportunity to engage families and younger readers.
#Revenue category
category_data = df[["Fiction_Sales", "Non_Fiction_Sales", "Children_Sales"]].sum().reset_index()
category_data.columns = ["Category", "Revenue"]

fig = px.bar(category_data, x="Category", y="Revenue",
             color="Category", title="Revenue by Book Category")
fig.show()Turning Data Into Dollars
Where Laura’s small data became big results:
Improving the Shopping Experience:
She created an express checkout line for customers with fewer than three items, cutting wait times by 40%.
Staff were trained to engage customers during quieter periods to recommend books, increasing the likelihood of sales.
Gift items for customers who shop over a certain amount. Gifts like bookmarks, book stickers, store-branded tote bags (I like this one), loyalty program rewards (discounts or free books), signed bookplates from authors during events, or even a free cup of coffee with a book purchase.
She added calming background music and spaced out display tables to reduce crowding.
2. Revitalizing Non-Fiction and Children’s Books:
Hosted a “Meet the Author” night featuring a local author for non-fiction fans, this increased sales by a close margin.
Created a “Kids’ Zone” with bean bags and toy stories to keep young readers entertained while parents shopped, boosting children’s book sales by 15%.
3. The Weekend Experience:
Additional staff were scheduled for weekends to reduce checkout lines.
Introduced soft background music to create a more inviting atmosphere.
Show me the Money…
2 months later, the results were in:
Sales Conversion Rate: Improved from an average of 50% to 65%, even during busy times.
Revenue Growth: Fiction retained its top spot, but children’s book sales increased by 10%, and Non-fiction grew by 15%.
Customer Satisfaction: Climbed from 8.2 to 9.0, with weekends seeing the largest improvement.
Net Promoter Score (NPS): A measure of customer loyalty, jumped from 70% to 85%.
Her bookstore was thriving again.
What I learned:
Always ask questions: Defining the problem is half the battle.
Leverage small data: Sometimes, you don’t need terabytes of data to uncover valuable insights.
Visualize for impact: Sometimes, a column chart can make your findings accessible, and help with quick decisions.
Make data actionable: Insights should be used to drive tangible improvements.
How to Harness Small Data for Big Wins
Focus on Trends: Use small datasets to identify quick opportunities, like improving popular products or addressing feedback trends.
Simple Visualizations: Small data can become impactful when paired with clear charts or graphs.
Iterate Often: Small datasets allow you to test hypotheses and make changes without waiting for massive amounts of data.
Conclusion:
Data Analysis Doesn’t Have to Be Complicated…
Challenge: So, whether you’re running a bookstore, a café, or any small business, think about a small dataset you already have access to. Maybe it’s a week of sales data or a customer feedback survey. Take a closer look. Ask the right questions. You might just find that the answers to your problems have been hiding in plain sight.
Because sometimes, the smallest data can have the biggest impact.
Human analysis, people analysis
The Human Side to Data: Shaping analytics for real-world impact
This is how data can be and should be used to shape real-world impacts.
Be data-informed, data-driven, but not data-obsessed — Amy
>>> Link to codes: https://github.com/YummyAmy/Laura-Den-Bookstore
→ Disclaimer: This analysis is based on a subset of the full data, opinions are mine.
Biz and whimsy: https://linktr.ee/ameusifoh
Connect with me on LinkedIn for more data analytics.


I really enjoyed the "what I learned" section here.
- Always ask questions: Defining the problem is half the battle - yes, agreed. With a background in lean six sigma, I always make this the first priority. You have to define the problem before you can solve for it.
- Visualize for impact: Sometimes, a column chart can make your findings accessible, and help with quick decisions - yes, double agree! Part of this is to think about your audience and know the stakeholders who will be reviewing your data. What type of chart will empower them to make a quick decision? If the chart you are building is too complex, it is time to go back to the drawing board. Graphs should visualize the data, not over complicate it.