

How much should a data professional earn?
Two people. Same title. Same company. Different earnings.

The playbook for raising your income
You’ve learned the tools, shipped some projects, and are polishing your skills. After about 6–8 months, you may want to update your headline to reflect your new role: data analyst, data scientist, BI analyst, or Data engineer.

Next, the question hits: “How much should I be making?”
You have probably researched it on Google or seen it on LinkedIn. It’s a fair question.
You didn’t choose a career in data purely for the love of dashboards. You want to do meaningful work and be paid well.
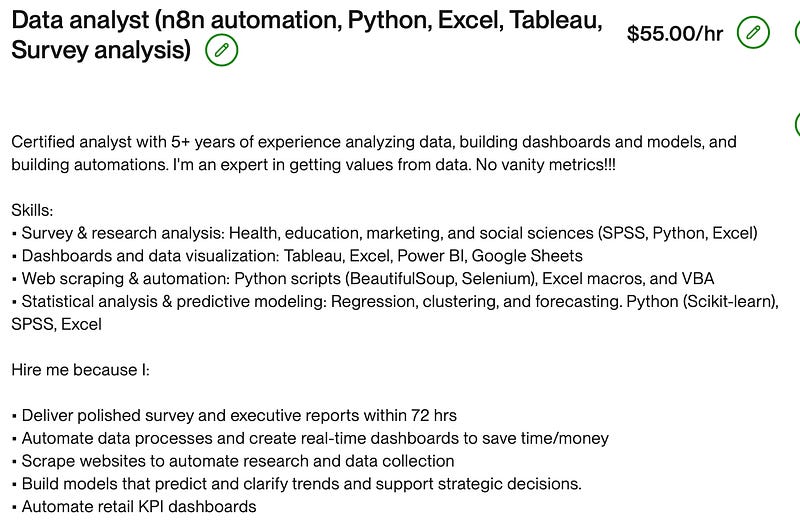
There is no single number. The number Google or ChatGPT shows you is a baseline for how you should think about “rate”. Recruiters will post a company hiring for skills and experience at $150/hr, but list it at $45.
That’s the job market in 2025.
A junior data analyst in a small town, working for a local nonprofit, won’t earn what a junior analytics engineer in a Silicon Valley startup does. They may have the same job title and work in the same company, but in different locations.
So, you have your first determinant: Location

What can move your income?
From my own experience (including on Upwork, where I’ve tested my value in the freelance market), there are 5 levers that impact how much you can earn:
Location: As I mentioned earlier, an analyst's earnings in Ohio or Alabama differ from those of someone in California or New York. Same title, different market dynamics. If you can work remotely, that also impacts your earnings.
Tools: This isn't a “master tools” suggestion. Whatever tool you use — SQL, Python, Power BI, Excel — focus on specializing in one area. Depth beats breadth.
I usually avoid the word 'niche' because it’s often used loosely, but in this case, niching down can help you stand out and boost your earnings.
It’s good to know how to use all these tools, but if you’re not an expert in any of them, clients and businesses will look for specialists.
Learning SQL is valuable. Adding Python or Power BI? Even better.
Become proficient in automation using tools such as Power Query, dbt, or Airflow. When clients say, “We didn’t know this was even possible,” it’s a sign to consider increasing your rate. Yes, they’re willing to pay for that.
3. Methods: Most data professionals can create a chart with Excel, Tableau, Alteryx, etc.
This is not the same as designing a test, building a forecast, or translating messy data into a decision framework.
Understanding methods like statistical modeling, time series forecasting, or experiment design changes how you’re seen — from “report builder” to “someone we can trust to advise us with our data.”
When you develop scalable methods, reduce cost or save the business money, and bring value to a company automatically, your rate should reflect that. Increase your rate!
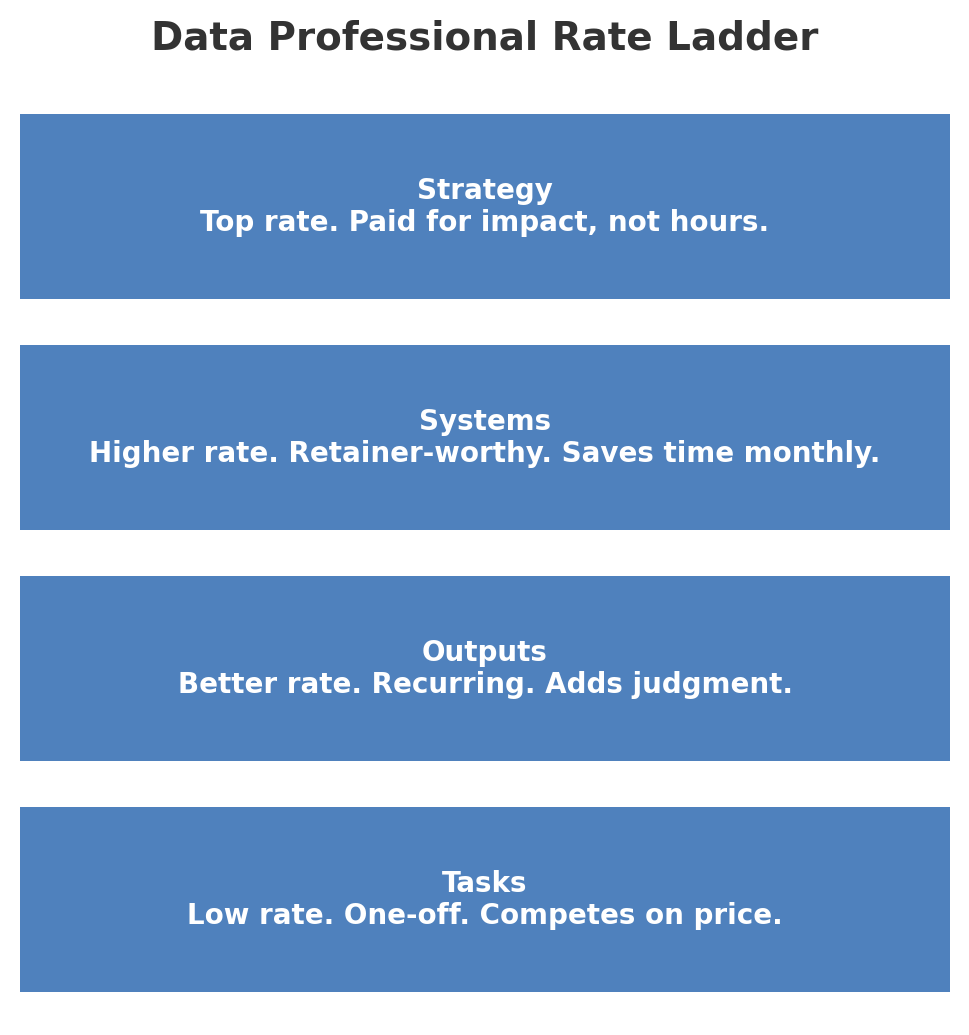
4. Ideas: You can bill for tasks or for thinking.
Suggest a better approach, package it, and own the result. When you start pitching solutions, you’re delivering what’s asked and more; you compete beyond price alone.
An idea that saves $10k/year is leverage. These are solutions you can bill for that analysis alone won’t get you.
I slightly hinted that I missed out on a contract because I was stuck with my analysis, and while I wished the client had given more details of what they wanted, I know I should have offered more.
And that’s why consultants make major coins.
5. Soft skills: I believe that communication, storytelling, and domain knowledge have earned me more recognition than my spreadsheets or code. They are multipliers.
If you are the best Python developer, but can’t explain your findings to a non-technical person in the room, someone else will get the promotion or the contract.
You must learn and master how to effectively combine soft skills with technical lingo.
You don’t want to sound simplistic, but you don’t have to confuse your audience.
My dad used to say: “Work it like a skirt, short enough to keep them hooked, long enough to cover every point necessary.”
Be the go-to person for codes and simplifying things. That’s brilliance.
My Upwork reality check
If you’ve read some of my articles, you will know I freelance on Upwork. I’m not earning a six-figure Upwork income — some months are slow, and I’ve underpriced myself before, and still do, if we’re being honest, because context matters.
But even with the smaller jobs, I’ve seen this pattern:
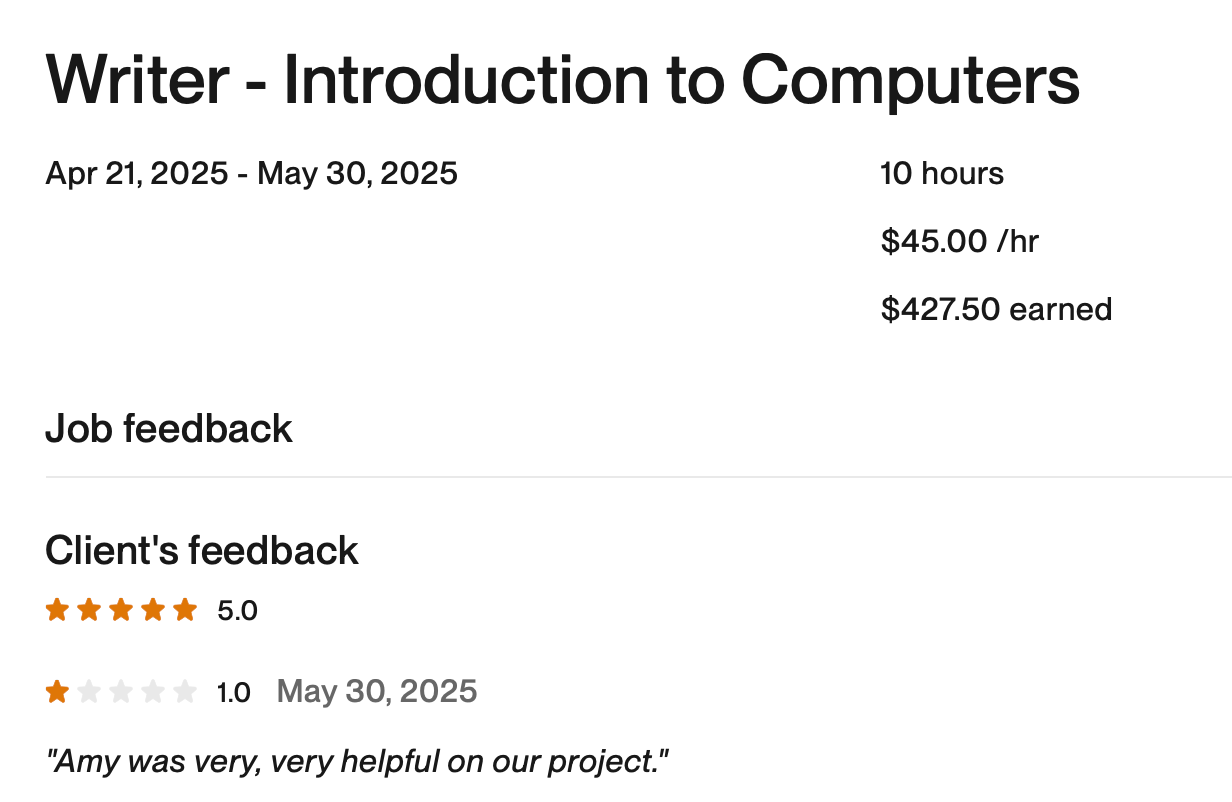
If I just “do the task,” I get paid the agreed fair but forgettable amount.
If I solve a bigger problem, suggest a better method, or create a reusable system, the rate jumps.
→ I am preparing a financial report for a Stanford student, and my rate is $30/hr. The client is a student, so it’s a limited budget and scope.
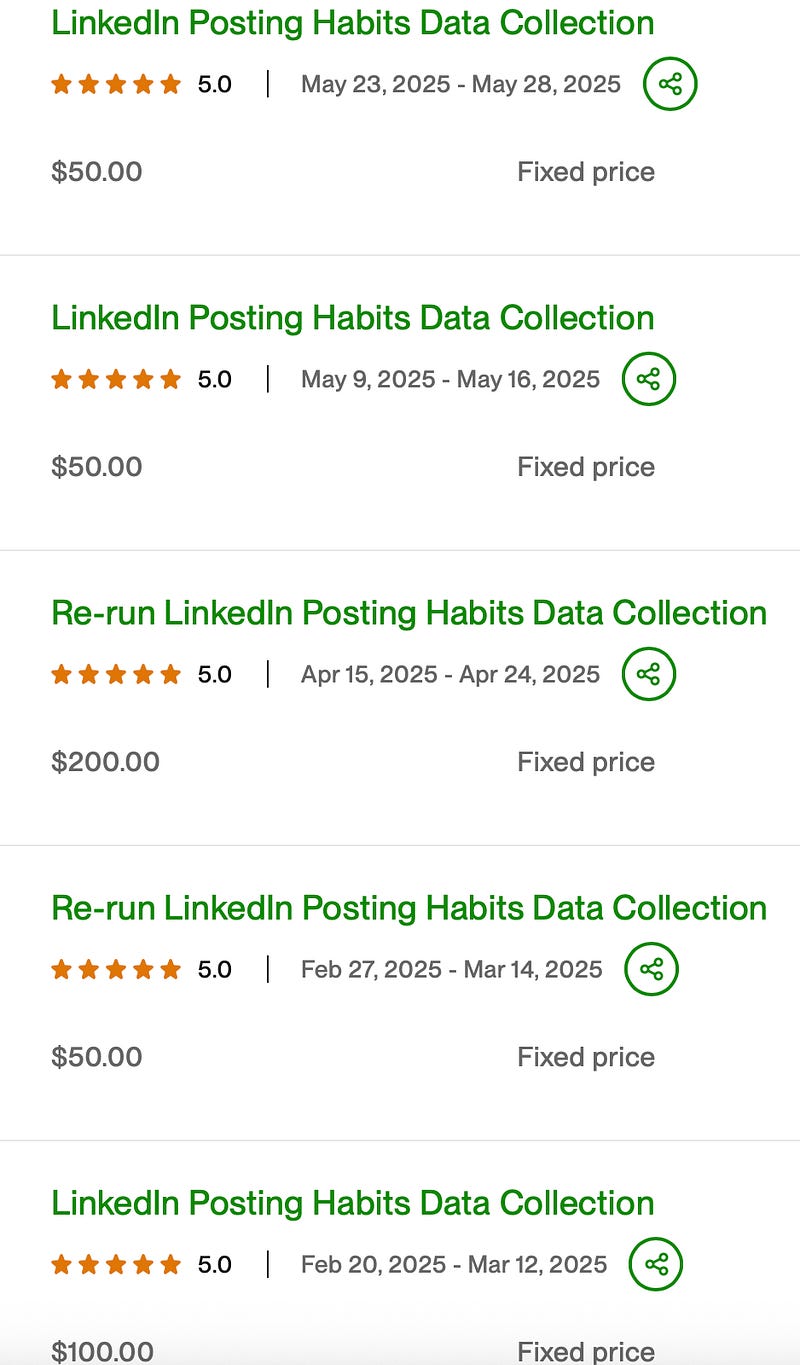
→ My LinkedIn analysis client pays $50–100 per contract. They are not in the US, and their country’s currency is weaker than the US dollar.
→ A client asked for “simple data cleaning”. I offered to set up a dynamic Power Query pipeline feeding into a monthly dashboard, something they could reuse every month. The scope was broad, so I increased my rate.
Broader scope, higher rate, repeat work.
My simple pricing heuristic
For freelance/contract work, I use:
Rate floor = (Target monthly gross ÷ 100 billable hrs) × risk factor (1.2–1.6).
It’s a simple format that stops me from undercharging when the scope is fuzzy or risky.
So… How much should you be making?
Enough to reflect the problems you solve, not just the tasks you complete.
If you want to push your earning potential:
Pick a tool you excel at and master it: Whether it’s through AI, YouTube, or certification — become a master of something.
Add a skill/method that feels “above your level”: If you’ve read my series, Achieving Data Maturity 1, I listed some ways you can demonstrate maturity in how you handle analysis or models. Forecasting and experimental design, or causal analysis, are some methods that can move the needle in how much you earn.
Start bringing ideas to the table. Be more than a task runner; bring ideas to the table.
Suggest dynamic ways to solve problems, debug code, improve pipelines, or automate the boring tasks. That’s how you rate your work.
Communicate like your paycheck depends on it. Keep it simple, not simplistic.
There’s no magic salary number, but with a good approach and experience, the needle can shift.
Your turn: What’s the one tool, skill, or idea that’s boosted your income the most? I’d love to compile a “data career income map” for a future post.
Enjoyed this? Read, comment, share with your team, subscribe for more.
Be data-informed, data-driven, but not data-obsessed
🔗 Biz and whimsy: https://linktr.ee/amyusifoh
🔗 Connect with me on LinkedIn and GitHub for more analytics insights.
🔗 Get the free design toolkit and workflow: dashboard design toolkit
Data analyst ⬩ Spreadsheet advocate ⬩ Freelancer ⬩ Turning data into useful insights
This is a great post! I agree about location being important. Even job description sometimes mention the rate varies depending if you are in a more “expensive” city or not.